2014 - 2015
Spring 2014 to October 2015: Recognition of the Importance of Time.
I. Horizontal Plane over Time.
Many observation hours were saved by the establishment that it was not necessary to record all three groups making up the 8-Pulse Dip pattern: i.e., by recording the location of only the 'strong', more easily distinguished, 'Single' Pulse-Dip (and excluding the less distinct 'Double' and 'Triple' zones) the key directional element of the 'External' stimulus could become the main focus thus, making it feasible to commence regular, fortnightly 'snap-shot' plans of the whole site. The first batch of these plans was drawn up during April and May, 2014.
Short-term shifts in position of the reaction pattern had given the appearance of being greatest at Full and New Moons. Such Lunar movements were regarded at the time as a hindrance to capturing the broad pattern thus, in order to keep these lunar shifts to a minimum and be able to produce a series of plans with a more stable horizontal structure, observations were made at 1st & 3rd quarters of the lunar cycle. However, there were consequences stemming from this choice (obvious with hindsight) but they only became manifest a year or so later.
The Site Plan shown previously in Fig. 2.5 (dated 2011>) had established that there were four Vector directions arranged in a 'Grid & Lattice'. Thus, on these new 2014 plans the pair of intersecting vectors making up the Grid parallels were designated with the letter 'P' while the pair making up the Diagonal Lattice were labelled 'D' (See Methods Fig. 1.9 and 2.18). Unfortunately, the initial ID arrangement on these initial plans reflected the 'dense' perception pattern discussed earlier and still prevalent at that point. However, by mid-June 2014, with fewer responses occurring over a given distance and a doubling of the space between them, some of the numbers used to record the 'single pulse' reactions became redundant. This 'tuning in' to a different harmonic, due to a change in the observer's physical state required a modification of the designation system (as outlined in the methods section) thus, gaps were introduced to the original coding arrangement to reflect the new 'Normal' relaxed mode. A revised notation was adopted, as shown in the actual record sheet for 15-19th June 2014 shown in Figure 2.16 (below). This new coding arrangement continued to be used throughout the remainder of the investigation with only minor modifications.

Fig. 2.16
A further complication was the constant psychological struggle between the conscious and subconscious when trying to identify and locate the 'Single' pulse reaction. Having become aware of the '8-pulse' pattern it was all too easy for the investigator/subject to use it as a mental image and just count the 'spaces' – which were much more distinct than the 'feel' of the dip that was taking place. Because, in these early days of this investigation, one was not always truly aware of the sensory reflex 'feel' of the three zonal widths, occasional mistakes were made in identification and therefore in the recorded position thus adding to the confusion.
However, despite these reservations about what was actually being recorded, in the period from Spring Equinox through to the Aphelion at the end of June/July 2014 the parallel reaction lines plotted on the plans appeared to be undergoing a gradual but substantial broad shift from East to West while their general North/South vector direction remained broadly constant: this change appeared to be much more significant than any of the minor lunar shifts that had occurred in the intervening period. The initial Westwards drift suggested there might be a connection between the Reaction Pattern and the Earth's magnetic field. But during the following six-month period, from June to December 2014, the movement ceased, making a link to the 'magnetic field' seem less likely.
Nevertheless, a subtle, elongated S-shaped, shift in position along a section of any of the four vectors often occurred from one fortnightly period to the next while simultaneously the general axis of direction remained broadly constant. When these shapes were examined in detail, they appeared to be part of a shallow arc, sometimes curving to the left and sometimes curving to the right (see photos below). These curved forms added more weight to the idea that they were the product of a moving wave of some sort. Arrival at this supposition naturally led to asking: 'What sort of wave movement?' There were several possibilities that needed to be investigated, all involved 'shape, direction and time'.


Two Photos of the reaction line De4/5, looking SW across the Workshop floor, plotted and marked in detail it shows an arc curving towards the SE (7/10/14)


Two Photos of the reaction line De4/5, the first looking SW and the second NE traced across the Workshop floor on 14/12/14. Plotted and marked in detail they show an arc curving towards NW - the opposite to that recorded in October and shown in the previous pair of photos.
By the end of 2014 a reliable overall picture of the 'Horizontal Plane' layout had begun to emerge on computer. This was achieved by combining each of the individually scanned fortnightly plans in a series of layers within a single 'Grid & Lattice' image (see fig. 2.17 below).
At this relatively early point in the investigation a possible difference in the movement occurring between the Grid (Red) and the Lattice (Blue) could not be entirely ruled out. The likelihood that the overall form was being created by stimuli from two separate external sources (?) had to remain under consideration, hence the colour differentiation used.

Fig. 2.17
Accumulated over 12 months or so, these fortnightly scale drawings were combined in a short video sequence in the hope that it might show a movement of some sort: unfortunately, none was revealed. The 'movement' over 'time' of the Grid & Lattice remained elusive. In retrospect, these Fortnightly Plans could only be arranged to make sense of the movement after the correct way to organise the time periods was found, and the true three-dimensional character of the data had become apparent; alas, that revelation was still some way off.
II. Vertical Plane over Time.
There had been tantalizing hints that the source stimulating the muscular reaction response was not acting along a straight path in the vertical plane, but was in fact curved and wave-like. Elevation drawings of the whole site, from various viewpoints, were drawn in late September and early October 2014 to view the relationship between the Grid & Lattice elements in the horizontal plane with those in the vertical plane. These elevations confirmed the three-dimensional character of the stimulus but highlighted the limitations of such a 'broad brush' approach: the mixing and compressing of vertical and horizontal planes in one flat portrayal is not ideal, whether in plan or elevation (see fig. 2.18 below). The complex task of depicting an 'unknown and invisible 3-D form' which also appeared to be 'moving' required more detailed sections where each one was broken down into a series of thin slices to allow distance and time to be noted.

Fig. 2.18
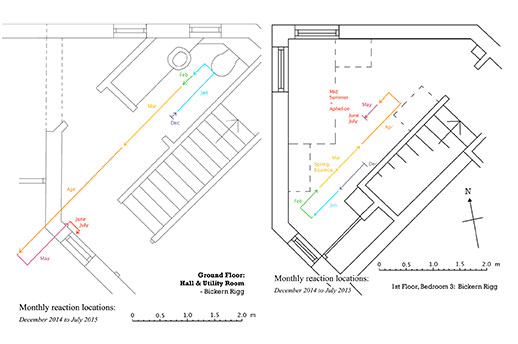
Commencing in December 2014 the number of locations for observation of vertical reaction-points was increased. Thus, two 'internal' points within the house on Vector Dn3 were selected for easy access (see fig. 2.19). One was located on the Ground Floor [B] (height a.s.l. 44.26 m) and a second at 1st floor height [A] (2.54 m vertically above). The same Vector, Dn3 was also examined at two 'external' locations along its 27 m horizontal length: at Dn3-Tarmac Path [C] adjacent to the showroom and at Dn3- Car Park [D]. Measurements were made at these four key locations on 16th Dec., 2014 and again one month later on 16th Jan., 2015. Unexpectedly, at the two different heights in the house, points A & B were found to be moving in 'opposite' directions (see arrows in section CC below). This 'contrary movement' was surprising and unanticipated: it prompted further investigation.

Fig. 2.19
Readings continued to be taken within the house at points A, B, C, & D throughout the year from Dec.'14 to October 2015 and they confirmed that the 'opposing' vertical plane movement at points A & B was a continuing feature. However, there appeared to be no evidence of such a movement occurring between the two outdoor locations C & D. The eleven-month results were plotted on a sectional drawing (see Fig. 2.20 below) and were also noted on house plans, at levels A & B, using an 'arrow-marked' path to show the passage of time (Fig. 2.21). They clearly illustrated the direction of movement, and added yet further weight to the emerging hypothesis that there was indeed 'an external stimulus, and its source was some kind of energy with a vertical wave structure' - although its precise form still remained somewhat ill-defined at this stage.

Fig. 2.20

Fig. 2.21
Running parallel to Dn3 was its neighbour - Vector Dn2, which was also examined in more detail. Unfortunately, only sections of limited height (approx. 1.3 m) could safely be studied in the vertical plane, and so emphasis was placed on discovering changes in the vector's angular shape at 7 key points along its 30-metre length. Vector Dn2's course was traced from the external NW corner of the site, besides the Entrance (point A in Figs 2.22 & 2.23 below) towards points B & C near the garage; passing through the Workshop (D) and exiting at the granite outcrop peak (points E & F); and terminating at the SE of the site, at the Birch Tree (X). Reasonably level spots existed along Vector Dn2 at the points chosen, and where vertical measurements were taken in a series of short sections from 27th Nov to 2nd Dec., 2014. The resultant individual angles of deviation from the vertical were noted and can be seen below in Fig. 2.24.

Fig. 2.22

Fig. 2.23

Fig. 2.24

Fig. 2.25
When these individual sections were then combined and brought together in a single diagram (see Fig. 2.25 above) the results appeared to indicate that at this specific location on the site the wave had a 4° angle of inclination to the theoretical 'horizontal' plane of the Earth surface i.e., it was not emerging perpendicular to it. Instead, the tilt appeared to be related to the broad incline of the bedrock, which sloped steadily up at an incline of approx. 6° over a distance of 625 m to the top of Doon Hill (69 m higher than the site- see fig. 2.26 below). However, to establish whether the 4° incline was a consistent feature within the whole site or whether it varied from location to location required further, more detailed investigation.

Fig. 2.26
These last results from Dn2 suggested it had a wavelength of somewhere in the region of 5.50 metres, which in fact was very similar to the wavelength of Dn3 drawn in figure 2.20. When the results of the investigations into Dn2 & Dn3 were considered in combination, it was felt that the construction of a 3-D model might be helpful to visualize the impact of a complex tilted wave-form on the landscape. Its form clearly showed how the S-shaped elongated form appeared in the horizontal plane investigations. A photograph of the model in its initial state can be seen below.
3-D Model of the wave-form in Perspex & Wood; showing the S-shaped results of the Vector's tilted angle when plotted in the horizontal plane.

